Each half of the belly contains half of 95% or 47.5%. This is why we look for the z-value connected to .4750 in the Normal Distribution Table.

| Confidence Intervals - 1 |
Confidence Intervals
definition: a range or interval of values obtained from sample data so that a population parameter or a sample statistic falls within that range at a predetermined probability termed the level of confidence.
The 2 most commonly used levels of confidence are 95% and 99%
with corresponding z-values of 1.96 (view table) and 2.58 (view table).
Confidence Interval about the Mean of a Normal Population
How to Find Critical Values of z
Using the Normal Distribution Table, we find that .4750 (47.5%) means z = 1.96
and .4950 (49.5% for a 99% c.i.) means z = 2.58.
To construct a 95% confidence interval about a mean l , we have to establish a lower and an upper data value, (symmetric about l), such that 95% of the population falls between them. So, the belly of the distribution contains 95% of the population in question and the tails include 5% divided equally between them which puts 2.5% of the population in each tail.
Each half of the belly contains half of 95% or 47.5%. This is why we look for the z-value connected to .4750 in the Normal Distribution Table.
To construct a 90% confidence interval about a population mean, we use
the z-value that includes 45% of the population on either side of l .
That z-value, called a critical value, is 1.645.
Our confidence interval has a lower bound of l – 1.645(r) and
an upper bound of l + 1.645(r)
Example 1
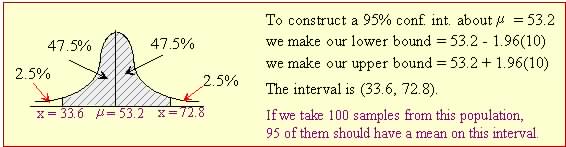
The image above tells us that the data values we need for the lower and upper
bound of the confidence interval are [53.2 – 1.96(10)] and [53.2 + 1.96(10)].
The 95% confidence interval for this population is (33.6, 72.8).
This means that we can be sure that 95 of 100 sample means taken from
this population will lie within this interval.
Here's the picture of our confidence interval about this mean l = 53.2
Example 2
Construct a 98% confidence interval for the mean of a population l = 230.7 if the standard deviation of this population is 26.9.
Solution
At 98% confidence level, we need 49% of the population in each half of the "belly" of the distribution. The Normal Table sets z = 2.33 for 0.4901 probability.
The lower bound will be 230.7 – 2.33(26.9) = 168.023,
The upper bound will be 230.7 + 2.33(26.9) = 293.377

Practice (view Normal table)
1) What level of confidence are we using if: (to nearest %)
| a) z = 2.06 | b) z = 1.88 | c) z = 2.17 |
2) Construct a 97% confidence interval about a mean l = 56.13 with r = 2.75.
State what values you use from the Normal Distribution table.
3) Construct a 90% confidence interval about a mean l = 6.39 with r = 0.575.
State what values you use from the Normal Distribution table.
.
.
Solutions
1) What level of confidence (to nearest %) are we using if:
| a) z = 2.06: 2(.4803) = 96 % | b) z = 1.88: 2(.4699) = 94 % | c) z = 2.17: 2(.4850) = 97% |
2) From 1(c) we learn that z = 2.17 creates a 97% interval so:
the lower bound is 56.13 – 2.17(2.75) = 50.163,
the upper bound is 56.13 + 2.17(2.75) = 62.098
The interval is (50.163, 62.098).
3) If z = 1.645, our interval will include exactly 90% of the distribution, so:
the lower bound is 6.39 – 1.645(.575) = 5.444,
the upper bound is 6.39 – 1.645(.575) = 7.336
The interval is (5.444, 7.336).
.
.

.
.
Normal Distribution Probabilities (Z-scores)
| Z | 0.00 | 0.01 | 0.02 | 0.03 | 0.04 | 0.05 | 0.06 | 0.07 | 0.08 | 0.09 |
| 0.0 | 0.0000 | 0.0040 | 0.0080 | 0.0120 | 0.0160 | 0.0199 | 0.0239 | 0.0279 | 0.0319 | 0.0359 |
| 0.1 | 0.0398 | 0.0438 | 0.0478 | 0.0517 | 0.0557 | 0.0596 | 0.0636 | 0.0675 | 0.0714 | 0.0753 |
| 0.2 | 0.0793 | 0.0832 | 0.0871 | 0.0910 | 0.0948 | 0.0987 | 0.1026 | 0.1064 | 0.1103 | 0.1141 |
| 0.3 | 0.1179 | 0.1217 | 0.1255 | 0.1293 | 0.1331 | 0.1368 | 0.1406 | 0.1443 | 0.1480 | 0.1517 |
| 0.4 | 0.1554 | 0.1591 | 0.1628 | 0.1664 | 0.1700 | 0.1736 | 0.1772 | 0.1808 | 0.1844 | 0.1879 |
| 0.5 | 0.1915 | 0.1950 | 0.1985 | 0.2019 | 0.2054 | 0.2088 | 0.2123 | 0.2157 | 0.2190 | 0.2224 |
| 0.6 | 0.2257 | 0.2291 | 0.2324 | 0.2357 | 0.2389 | 0.2422 | 0.2454 | 0.2486 | 0.2517 | 0.2549 |
| 0.7 | 0.2580 | 0.2611 | 0.2642 | 0.2673 | 0.2704 | 0.2734 | 0.2764 | 0.2794 | 0.2823 | 0.2852 |
| 0.8 | 0.2881 | 0.2910 | 0.2939 | 0.2967 | 0.2995 | 0.3023 | 0.3051 | 0.3078 | 0.3106 | 0.3133 |
| 0.9 | 0.3159 | 0.3186 | 0.3212 | 0.3238 | 0.3264 | 0.3289 | 0.3315 | 0.3340 | 0.3365 | 0.3389 |
| 1.0 | 0.3413 | 0.3438 | 0.3461 | 0.3485 | 0.3508 | 0.3531 | 0.3554 | 0.3577 | 0.3599 | 0.3621 |
| 1.1 | 0.3643 | 0.3665 | 0.3686 | 0.3708 | 0.3729 | 0.3749 | 0.3770 | 0.3790 | 0.3810 | 0.3830 |
| 1.2 | 0.3849 | 0.3869 | 0.3888 | 0.3907 | 0.3925 | 0.3944 | 0.3962 | 0.3980 | 0.3997 | 0.4015 |
| 1.3 | 0.4032 | 0.4049 | 0.4066 | 0.4082 | 0.4099 | 0.4115 | 0.4131 | 0.4147 | 0.4162 | 0.4177 |
| 1.4 | 0.4192 | 0.4207 | 0.4222 | 0.4236 | 0.4251 | 0.4265 | 0.4279 | 0.4292 | 0.4306 | 0.4319 |
| 1.5 | 0.4332 | 0.4345 | 0.4357 | 0.4370 | 0.4382 | 0.4394 | 0.4406 | 0.4418 | 0.4429 | 0.4441 |
| Z | 0.00 | 0.01 | 0.02 | 0.03 | 0.04 | 0.05 | 0.06 | 0.07 | 0.08 | 0.09 |
| 1.6 | 0.4452 | 0.4463 | 0.4474 | 0.4484 | 0.4495 | 0.4505 | 0.4515 | 0.4525 | 0.4535 | 0.4545 |
| 1.7 | 0.4554 | 0.4564 | 0.4573 | 0.4582 | 0.4591 | 0.4599 | 0.4608 | 0.4616 | 0.4625 | 0.4633 |
| 1.8 | 0.4641 | 0.4649 | 0.4656 | 0.4664 | 0.4671 | 0.4678 | 0.4686 | 0.4693 | 0.4699 | 0.4706 |
| 1.9 | 0.4713 | 0.4719 | 0.4726 | 0.4732 | 0.4738 | 0.4744 | 0.4750 | 0.4756 | 0.4761 | 0.4767 |
| 2.0 | 0.4772 | 0.4778 | 0.4783 | 0.4788 | 0.4793 | 0.4798 | 0.4803 | 0.4808 | 0.4812 | 0.4817 |
| 2.1 | 0.4821 | 0.4826 | 0.4830 | 0.4834 | 0.4838 | 0.4842 | 0.4846 | 0.4850 | 0.4854 | 0.4857 |
| 2.2 | 0.4861 | 0.4864 | 0.4868 | 0.4871 | 0.4875 | 0.4878 | 0.4881 | 0.4884 | 0.4887 | 0.4890 |
| 2.3 | 0.4893 | 0.4896 | 0.4898 | 0.4901 | 0.4904 | 0.4906 | 0.4909 | 0.4911 | 0.4913 | 0.4916 |
| 2.4 | 0.4918 | 0.4920 | 0.4922 | 0.4925 | 0.4927 | 0.4929 | 0.4931 | 0.4932 | 0.4934 | 0.4936 |
| 2.5 | 0.4938 | 0.4940 | 0.4941 | 0.4943 | 0.4945 | 0.4946 | 0.4948 | 0.4949 | 0.4951 | 0.4952 |
| 2.6 | 0.4953 | 0.4955 | 0.4956 | 0.4957 | 0.4959 | 0.4960 | 0.4961 | 0.4962 | 0.4963 | 0.4964 |
| 2.7 | 0.4965 | 0.4966 | 0.4967 | 0.4968 | 0.4969 | 0.4970 | 0.4971 | 0.4972 | 0.4973 | 0.4974 |
| 2.8 | 0.4974 | 0.4975 | 0.4976 | 0.4977 | 0.4977 | 0.4978 | 0.4979 | 0.4979 | 0.4980 | 0.4981 |
| 2.9 | 0.4981 | 0.4982 | 0.4982 | 0.4983 | 0.4984 | 0.4984 | 0.4985 | 0.4985 | 0.4986 | 0.4986 |
| 3.0 | 0.4987 | 0.4987 | 0.4987 | 0.4988 | 0.4988 | 0.4989 | 0.4989 | 0.4989 | 0.4990 | 0.4990 |
| Z | 0.00 | 0.01 | 0.02 | 0.03 | 0.04 | 0.05 | 0.06 | 0.07 | 0.08 | 0.09 |
.