
| CURVE SKETCHING |
The first derivative of a function represents the slope of the tangent to that function's curve at each point. (see The Derivative: or What's the Slope of Your Surfboard? in MathRoom Musings) So it's pretty obvious that points where the tangent or surfboard slope = 0 must be points at the crest or trough of the wave since a line with slope = 0 is a horizontal line.
The horizontal line which touches the curve at x = 4 has slope = 0. Notice that it's at the vertex, minimum or critical point. Every tangent left of x = 4 will have a negative slope and every tangent right of x = 4 will have a positive slope. Note that left of x = 4, f(x) is decreasing and right of x = 4, f(x) is increasing -- so the sign of the 1st derivative determines where f(x) increases and decreases.
.
| The First Derivative Test | |
| first derivative info | function curve info |
| points where f '(x) = 0 or º | critical points (max, min, point of inflection) |
| on intervals where f '(x) > 0 | f(x) is increasing |
| on intervals where f '(x) < 0 | f(x) is decreasing |
| if over an interval f '(x) goes + 0 - then | local max at point where f '(x) = 0 |
| if over an interval f '(x) goes - 0 + then | local min at point where f '(x) = 0 |
.
| first derivative test | second derivative test | graph properties list | asymptotes |
| sample graph | holes in the graph | practice | solutions |
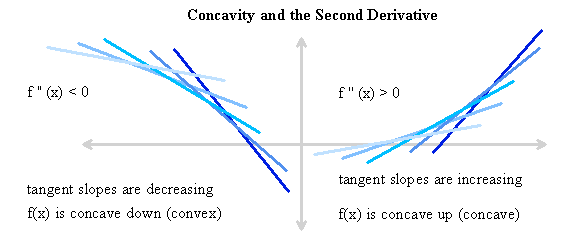
Since the sign of the 2nd derivative indicates where the slope of the tangent {f '(x)} to the function f(x) is increasing and decreasing, it determines the shape of the curve for f(x).
Where f ''(x) > 0 , f '(x) is increasing -- so the slopes of the tangents to f(x) are increasing and vice versa.
Let's make a sketch of a bunch of tangents with increasing and decreasing slopes to see what shapes they define.
.
It should be obvious then that if there is a point where f ''(x) = 0, the curve is changing convexity at that point.
This is called a point of inflection.
.
| The Second Derivative Test | |
| second derivative info | function curve info |
| points where f ''(x) = 0 | point of inflection |
| on intervals where f ''(x) > 0 | f(x) is concave up |
| on intervals where f ''(x) < 0 | f(x) is concave down |
| if f '(c) = 0 and f "(x) < 0 , then | local max at (c f(c) ) |
| if f '(c) = 0 and f "(x) > 0 , then | local min at (c f(c) ) |
if f '(c) = 0 and f '' (c) > 0, then (c, f(c) ) is a local minimum
since it's a critical point on a concave up curve.
if f '(c) = 0 and f '' (c) < 0, then (c, f(c) ) is a local maximum
since it's a critical point on a concave down curve.
.
| first derivative test | second derivative test | graph properties list | asymptotes |
| sample graph | holes in the graph | practice | solutions |
.
When we're asked to sketch the graph of a given function, we use the 1st and 2nd derivative tests and other methods to make a list of properties for the function.
Thanks to an old Calculus text book written by a fellow named Bonic, we have an acronym for the first letters of the items in the list. It is M2I2ACIDS an acronym for:
| M2 = max, min, | I2 = intercepts, inflection points, | A = asymptotes, | C = convexity, |
| I = increasing | D = decreasing | S = symmetry |
Below is such a list. Note the numbers beside the list items. They tell us in what order to "fill in the blanks".
5) MAXIMUM: f '(x) = 0, f '' (x) < 0
6) MINIMUM: f '(x) = 0, f '' (x) > 0
1) INTERCEPTS: set x = 0 for y-int, set y = 0 for x-int.
9) INFLECTION POINT: f '' (x) = 0
2) ASYMPTOTES: vert: x's that make only the denominator = 0
7) CONCAVE UP: f '' (x) > 0.
8) CONCAVE DOWN: f '' (x) < 0.
3) INCREASING: f '(x) > 0.
4) DECREASING: f '(x) < 0.
10)SYMMETRY: look at the graph.
We do the analysis in 3 steps.
1) Start with the intercepts and asymptotes,
2) find the 1st derivative fill in the info, and
3) find the 2nd derivative, fill in the info. Then graph the curve.
.
| first derivative test | second derivative test | graph properties list | asymptotes |
| sample graph | holes in the graph | practice | solutions |
.
Remember that asymptotes are lines and therefore we must write an equation for the asymptote line. We cannot just say the asymptote is 3 or -2. It must be x = 3 or x = -2 !
VERTICAL ASYMPTOTES are caused by x-values that make only the denominator = 0
The vertical asymptotes of
 are x = 2 and x = - 4.
X-values that make both numerator and denominator = 0 cause a hole in the graph. In such cases, there is only a single point missing rather than an infinite set of points. Such a hole is called a removeable jump or discontinuity since defining a value for f(x) at that point eliminates the discontinuity. See note Holes in the Graph.
HORIZONTAL ASYMPTOTES define the behavior of the curve at the extremes of the domain -- that is -- what's happening to the y-values as x approaches negative or positive infinity.
This is why we find
 to determine the horizontal asymptotes. The graph may cross the y-value of the asymptote at certain points -- but will only approach this value as x t º.
Finding limits at infinity:
If f(x) is a rational function (a fraction), and the degree of the numerator is less than or equal to the degree of the denominator, divide all terms by the highest power of x and then set x = º. Anything with a denomintor of º becomes 0.

If the degree of the numerator is greater than the degree of the denominator, divide the fraction to get a polynomial and perhaps a fraction remainder. Now we're looking at oblique asymptotes.
OBLIQUE ASYMPTOTES:
If y =
![]() and the degree of f(x) is > the degree of g(x), divide g(x) into f(x) to obtain
and the degree of f(x) is > the degree of g(x), divide g(x) into f(x) to obtain
y = ax + b +
 . The line y = ax + b is the oblique asymptote.
.
| first derivative test | second derivative test | graph properties list | asymptotes |
| sample graph | holes in the graph | practice | solutions |
.
We will list the M2I2ACIDS features of
![]() and graph it.
and graph it.
1) INTERCEPTS: if x = 0 then y = 0 so (0, 0) is both intercepts.
2) ASYMPTOTES: Vertical: if x = 4 then denom. = 0 so x = 4 is a vertical asymptote.
Horizontal:
 = 3, so y = 3 is the horizontal asymptote.
first derivative:
3) INCREASING: none since f '(x) < 0 always
4) DECREASING: for all x
5) MAXIMUM: none since f '(x) ! 0.
6) MINIMUM: none since f '(x) ! 0.
second derivative:
7) CONCAVE UP: x > 4
8) CONCAVE DOWN: x < 4
9) INFLECTION POINT: none since f '' (x) is never = 0.
.
.
graph

5) MAXIMUM: none
6) MINIMUM: none
1) INTERCEPTS: (0,0)
9) INFLECTION POINT: none
2) ASYMPTOTES: vert: x = 4 horiz: y = 3
7) CONCAVE UP: x > 4
8) CONCAVE DOWN: x < 4
3) INCREASING: never
4) DECREASING: for all x
10)SYMMETRY: to the point (4, 3).
.
| first derivative test | second derivative test | graph properties list | asymptotes |
| sample graph | holes in the graph | practice | solutions |
.
HOLES IN THE GRAPH occur when an x value (x = a) makes both numerator and denominator of a fraction = 0. To find the missing y value, find the
 .
.
ex: f(x) =
 has a hole at x = 3. Proceed like this:
 . There is a hole in the graph at (3, 1/6).
.
.
1) Apply the 1st and 2nd derivative tests to find the critical and inflection points, increasing, decreasing, concave up and concave down intervals, for each function. Label each critical point a max or min.
| a) f(x) = x 3 - 3x 2 + 1 | b) g(x) = 3x 4 - 4x 3 |
 |
.
2) Draw the graph of and list the M2I2ACIDS features (& any other important features) for

*Clearly indicate f '(x), f ' '(x) and how you found the asymptotes.(hint: factor the demominator).
.
3) Sketch the graph of the continuous function f(x) which satisfies all of these conditions:
| f(0) = 4 | f(2) = 2 | f(5) = 6 |
| f '(0) = f '(2) = 0 | f '(x) > 0 if | x - 1 | > 1 | f '(x) < 0 if | x - 1 | < 1 |
| f ''(x) < 0 | if x < 1 | if | x - 4 | < 1 |
| f ''(x) > 0 | if | x - 2 | < 1 | if x > 5 |
.
| first derivative test | second derivative test | graph properties list | asymptotes |
| sample graph | holes in the graph | practice | solutions |
.
1)
| a) f(x) = x 3 - 3x 2 + 1 f ' (x) = 3x 2 - 6x = 3x (x - 2) f ' (x) = 0 at x = 0 and x = 2 (critical pts.) f ' (x) < 0 on 0 < x < 2, decreasing f ' (x) > 0 on x < 0 and x > 2, increasing f "(x) = 6x - 6 = 6(x - 1) f "(x) = 0 at x = 1, point of inflection f "(x) < 0 on x < 1, concave down f "(x) > 0 on x > 1, concave up x = 0 is a max (on concave down interval) x = 2 is a min (on concave up interval). |
b) g(x) = 3x 4 - 4x 3 g '(x) = 12x 3 - 12x 2 = 12x 2 (x - 1) g '(x) = 0 at x = 0 and x = 1 (critical pts.) g '(x) < 0 on x < 1, decreasing g '(x) > 0 on x > 1, increasing g "(x) = 36x 2 - 24x = 12x (3x - 2) g "(x) = 0 at x = 0 and x = 2/3, inflection pts. g "(x) < 0 on 0 < x < 2/3, concave down g "(x) > 0 on x < 0 and x > 2/3, concave up x = 0 is a point of inflection x = 1 is a minimum (concave up interval) this is a parabola opening upwards. |

This function has 2 vertical asymptotes at x = -1 and x = 1

h '(x) = 0 at x = 0, (critical point)
h '(x) < 0 when x > 0, since the denominator is always > 0.(decreasing)
h '(x) > 0 when x < 0, (increasing)

h "(x) ! 0 since the minimum value of the numerator is = 1, no inflection points.
h "(x) < 0 on -1 < x < 1, concave down
h "(x) > 0 on x < -1 and x > 1, concave up
x = 0, critical point is a maximum (on concave down interval).
.
2) Draw the graph of and list the M2I2ACIDS features for

This function has a hole in the graph at x = 3 since both numerator and denominator = 0.
We do the analysis on
 , then find the limit as x t 3 for the original function.
Step 1: intercepts & asymptotes
When x = 0, g(0) = -1/2 -- so (0, -1/2) is y-intercept
VA: x = 2, HA: y = 0
Step 2: first derivative

g '(x) < 0 ¼ x since the numerator is a negative constant, denominator is a perfect square.
g(x) is decreasing ¼ x
Since g '(x) ! 0, no max, no min.
Step 3: second derivative

g "(x) ! 0, no points of inflection.
g "(x) < 0 when x < 2, concave down.
g "(x) > 0 when x > 2, concave up.
Hole in the graph at x = 3
 , hole at (3, 1) -- only 1 hole -- so no symmetry.

.
3) Sketch the graph of the continuous function f(x) which satisfies all of these conditions:
| f(0) = 4 so (0, 4) is a point |
f(2) = 2 so (2, 2) is a point |
f(5) = 6 so (5, 6) is a point |
| f '(0) = f '(2) = 0 critical points |
f '(x) > 0 if | x - 1 | > 1 increasing intervals on x < 0, and x > 2 |
f '(x) < 0 if | x - 1 | < 1 decreasing intervals on 0 < x < 2 |
| f ''(x) < 0 concave down |
if x < 1 | if | x - 4 | < 1 3 < x < 5 |
| f ''(x) > 0 concave up |
if | x - 2 | < 1 on 1 < x < 3 |
if x > 5 |

.
| first derivative test | second derivative test | graph properties list | asymptotes |
| sample graph | holes in the graph | practice | solutions |
.
Back to Calculus 1 Lessons Links List
